Long term moving average crossovers in practice
14 May (blog 2)
The relative strength of the Amex Golf Bugs Index (HUI) against the S&P 500 Index has been in a long term uptrend. For many years, the moving averages have been in the same alignment (short above long and rising) but now this is changing.
I limit my use of moving averages to picking out long term changes shown by moving average crossovers. As this example will show though, these are not particularly a timing tool, they just tell you that a long term trend has changed.
Amex Gold Bugs Index (HUI) vs S&P 500 Index (monthly chart)
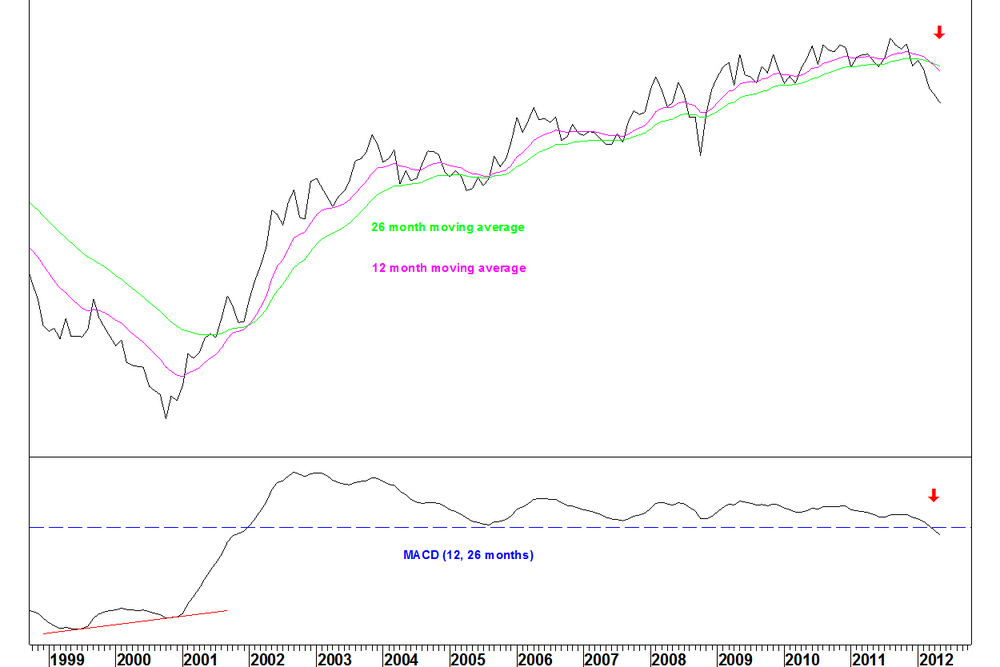
- Following 10 years of the 12 month average being above the 26 month average, there was a moving average crossover in April
- Another way of showing this is that the MACD indicator crossed below zero
- There were multiple bearish divergences on the MACD indicator, through most of the last 10 years but you have to wait for the crossover rather than try to guess which divergence will work
- Note there was bullish divergence on the MACD at the 2000 low, same on the RSI (not shown)
All this does is tell us that something has changed. The relative strength had to fall a long way to give this signal. It not a timing tool.
Weekly chart

- The relative strength line has almost halved since its September 2011 peak
- The 14 week RSI is oversold and although the RSI divergence criteria are not yet met, there could easily be a recovery soon.
- There is no guarantee that any recovery will stop at the moving averages
- Given that the moving averages were aligned one way for so long, now they have crossed this represents a change, so we cannot expect a recovery to be sustained
- More likely, a recovery would just be an unwinding from oversold before the downtrend resumes
Leave a Comment
