16 October
This example is complete hindsight analysis but I want to show what I can do with my breadth tool FIRE and how combining it with my other methods (RSI divergence this time) can identify rare, high probability trading opportunities. Firstly, the weekly chart of the S&P Metals & Mining Index vs. S&P500 Index shows a (very slight) weekly bullish RSI divergence in late July. That is one of the criteria of my RSI divergence method.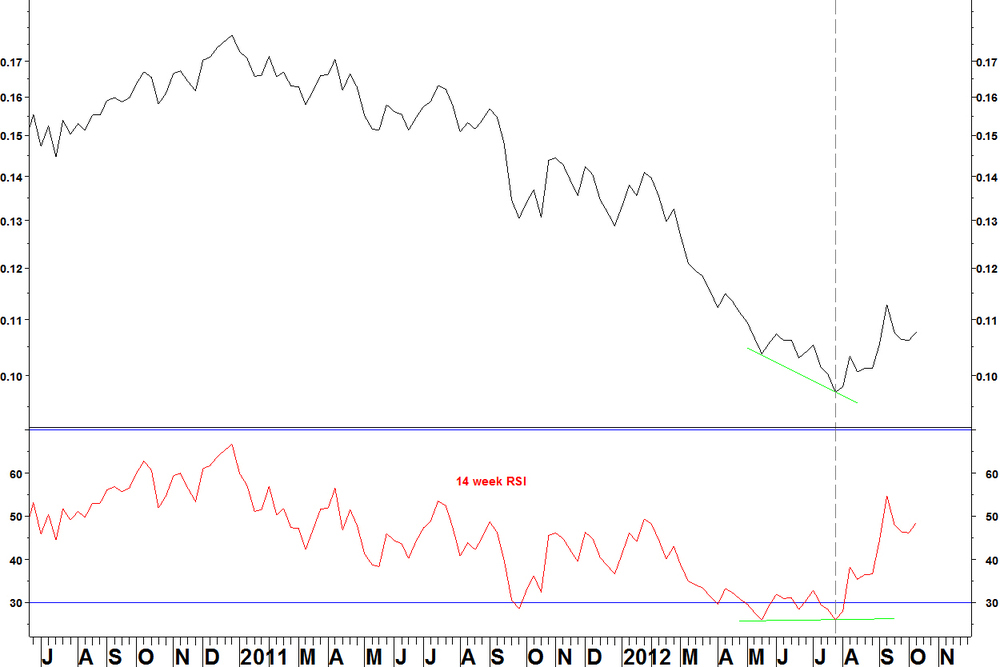
Secondly, the daily chart of the same ratio shows a divergence in May that failed to hold, then another divergence in late July but with the RSI above 30. That is another of the criteria of my RSI divergence method.

Now, look at the breadth chart for the SPDR S&P Metals and Mining (XME). This shows the percentage of stocks above their 200 day moving average. It is calculated in FIRE, my customisable breadth product, using the exact list of components of the ETF.
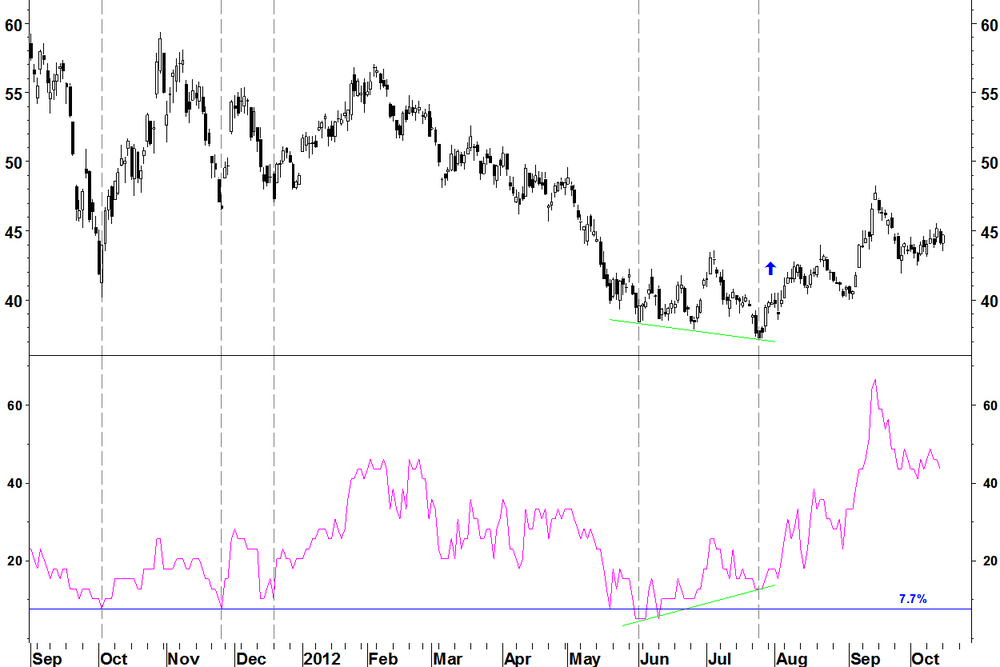
- There has been an oversold level of breadth of 7.7% (3 of the 39 components above their 200 day moving average), which marked short term lows last autumn (fall)
- Breadth reached this level and just below it (2 of 39 components) in May and June 2012
- The price low for XME came on 25 July with breadth at 12.8% (5 components). This was a bullish breadth divergence
- From that point, price rallied from $37 to $47 at the mid September high
This example shows two rare events coinciding, so increasing their significance. Think about what an RSI divergence is: it is a weakening of momentum at an extreme. It isn’t surprising that at times, this also manifests itself as a breadth divergence.
Work with me and I can find this is the sort of example for you, although understand that they are rare, that’s why they matter. A few final points:- Entry techniques to these trades can vary. For a start, this example combined absolute and relative charts. Which trade would you take?
- My method has the entry signal as a move above the intervening weekly RSI high, which doesn’t come until 10th August, marked on the daily chart. The ratio pulls back for four weeks before moving into the mid September high. Therefore this entry method is not ideal in this case
- Often with these RSI divergences, the follow through can be delayed
16 October
For the first time since the new bull market started in March 2009, large cap stock breadth is starting to fail. The chart shows the S&P 100 Index (OEX) and the cumulative advance/ decline line for these stocks.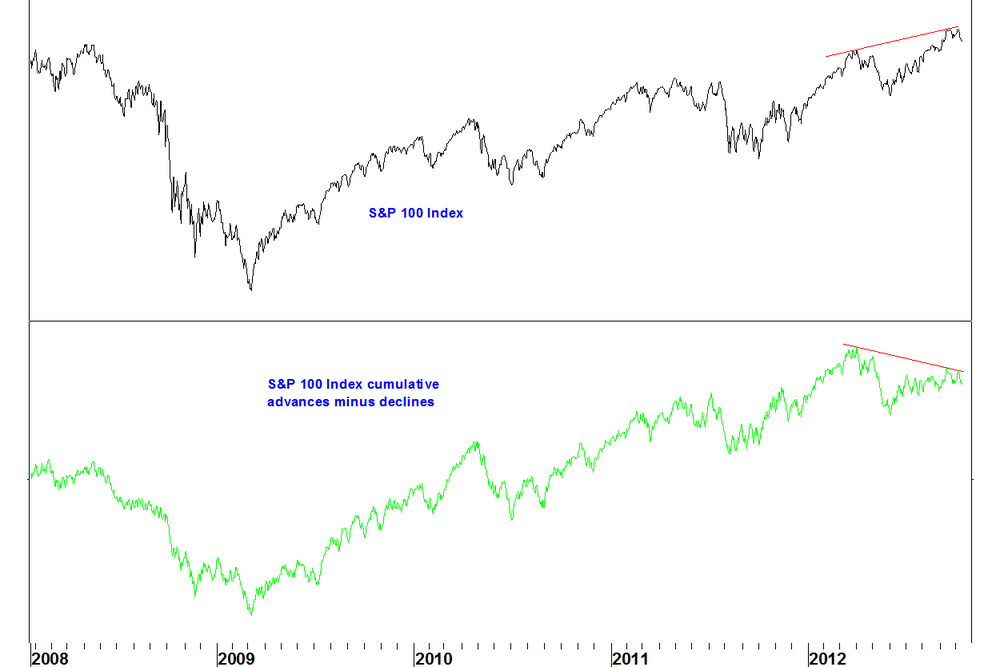
Divergence appears for the first time in this bull market. This data only begins at the start of 2008, so we don’t have a long track record to judge this indicator on.
I just put this out as something to be aware of. There are other breadth indicators that do not show divergences and I will do a bigger recap later this week. The consumer discretionary sector is factor in creating this divergence.Remember that a breadth divergence does not automatically mean price will fall immediately, just that it makes the uptrend vulnerable.
15 October
The short position in Apple (AAPL) makes progress. Having entered the position at $667.10, it shows $37 of profit. I will close one third of the position and move the stop loss to break even.
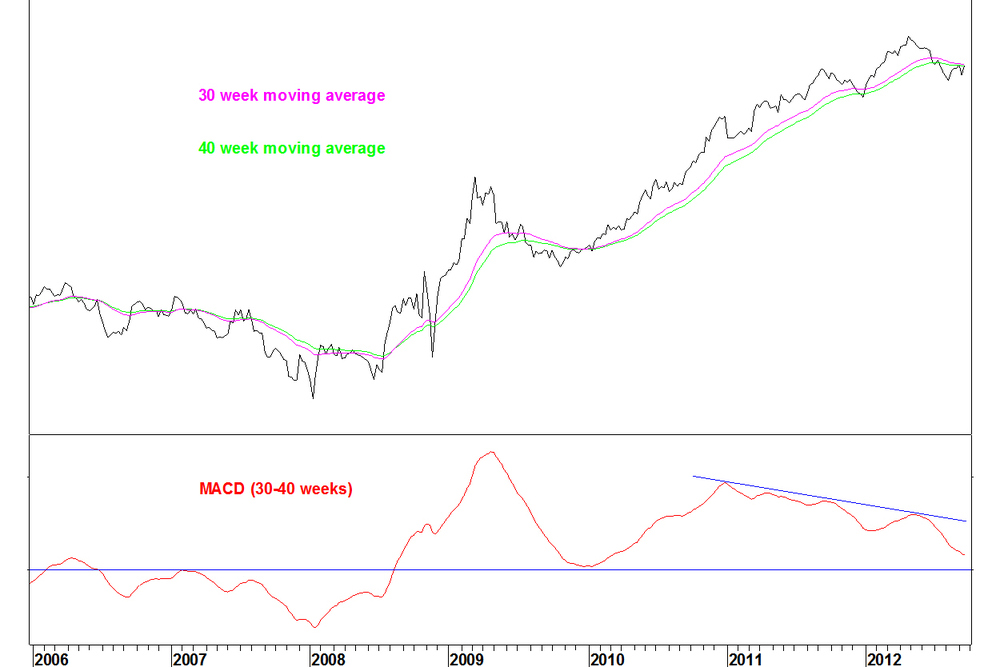
The position in National Bank of Greece (NBG) vs. S&P500 Index continues to make progress. The weekly chart is not overbought yet

The daily chart shows a divergence was formed on 08 October, which can be an excuse to take profit. The stop loss on the remaining part of the position is moved up to below the 24 September low.

On 25 September, some long term rotations against auto retail and in favour of utilities were shown. These have mostly gone sideways over the last few weeks and some of these long term rotations require final confirmation from a moving average crossover.
The example that has made most progress over the last few weeks (not shown last time) was O’Reilly Automotive (ORLY) v Edison International (EIX).
Here is Autozone (AZO) v Edison International (EIX), which was shown and also makes some progress.

01 October
Last week, I set out the entry criteria for a short position in Apple. These were fulfilled by Friday’s closing price.
Weekly chart
- The weekly swing high was formed, the price closed at $667.10
- The RSI has moved back below 70. I said to take that as the entry rather than a move below the intervening RSI low from May
Daily chart
- The price ended the week below the intervening low, following the RSI divergence
- The absolutely ideal entry criteria would be a new high with the 14 day RSI staying below 70. That is still a possibility and a slight risk, given that we may get a short term bounce
- I will record the short position entry price as $667.10 but if you have not yet taken this position, you may want to see whether there is a rally over the next few days (the futures are up) and then sell a failure of that
26 September
This is a quick update on my article of 17 September on Apple.
The move down this week so far is significant for the following reasons. Where I mention weekly indicators, the move must be maintained by the end of the week to be valid.
- The weekly RSI has moved back below 70, setting up the bearish divergence between the April and September highs
- A weekly swing high will be formed from the last three weeks’ bars (ask me if you’re not sure what that means)
- The 14 day RSI broke above 70 on 17 September, setting up a divergence against the August high
- A daily RSI sell signal has now been given by a break below the intervening low from 11 September
- We didn’t quite get my daily RSI criteria of a new price high with the RSI below 70 but the weekly criteria are more important
In my RSI divergence criteria, I state that the entry signal is a weekly close of the RSI below the intervening low. Here, the intervening low is an RSI of 53.4 from 18 May. That is quite a way lower and may require another down week to occur, making the risk/ reward less attractive.
In the next line in my criteria, I say that at times, a weekly bar reversal can be taken as an entry signal. I think, given the MACD confirmation and the relative strength (vs. the S&P500 Index) also showing an RSI divergence, that this is one of those times that a weekly reversal bar can be taken.
Recommendation
Open a short position in Apple at the end of this week if the current situation described above is maintained. Set the stop loss as a new high. The pre market price at the time of writing is $670, giving a stop loss 5.2% higher.
25 September
Four weeks ago, I described a possible long term rotation: long utilities, short auto retail stocks. This rotation is setting up according to my moving average crossover criteria. I realise that this is quite an obscure set of stocks but I want to show that I can find examples meeting my criteria, although they occur quite rarely. These long term moving average crossover examples are not always as practically tradable as the RSI and Bollinger Band examples, in terms of clear entry criteria and stops. They can inform you of broader market developments though. The criteria are:- A pair of moving averages that has not crossed over for four years
- Divergence on the MACD indicator
- Final confirmation given by the moving average crossover
Examples
The examples are shown with 30 and 40 week exponential moving averages.The MACD indicator is based on these averages. It is percentage based, to not be skewed by the wide range of ratio values for the stock pair. Autozone (AZO) v Entergy Corp (ETR)
- The MACD last crossed zero in August 2008
- Divergence has built up since the first peak in 2009, however divergences can last a long time
- The uptrend, whether taken from the 2008 or 2009 low is broken
- The MACD has not crossed zero yet, that will be final confirmation of this rotation
- If you are managing a US stock portfolio, I would not wait for that cross to adjust my stock weightings. I expect this crossover to occur
Autozone (AZO) v Nextera Energy (NEE)

- Likewise, the MACD last crossed zero in August 2008 and divergence has built up, particularly since January 2011
- The moving averages have crossed now, so this long term rotation is signaled
O’Reilly Automotive (ORLY) v Nextera Energy (NEE)

- The MACD crossed zero in October 2008, so this example is one month short of four years, never mind
- Divergence occurred with each peak up to May 2012
- The moving averages have now crossed over, so this long term rotation is signaled
Autozone (AZO) v Public Service Enterprise (PEG)

- The MACD crossed zero in August 2008
- Divergence has occurred with each peak
- The trendline from the 2007 low is broken
- Confirmation of this rotation is required by a crossover of the MACD below zero
Autozone (AZO) v Edison International (EIX)

- The MACD crossed zero in July 2008. It briefly went below zero in January 2010. This was such a minor break that I’ll ignore it for the four year stipulation
- MACD divergence has been in place since 2010 and now, the moving averages have crossed
- The signal for this long term rotation is given
17 September
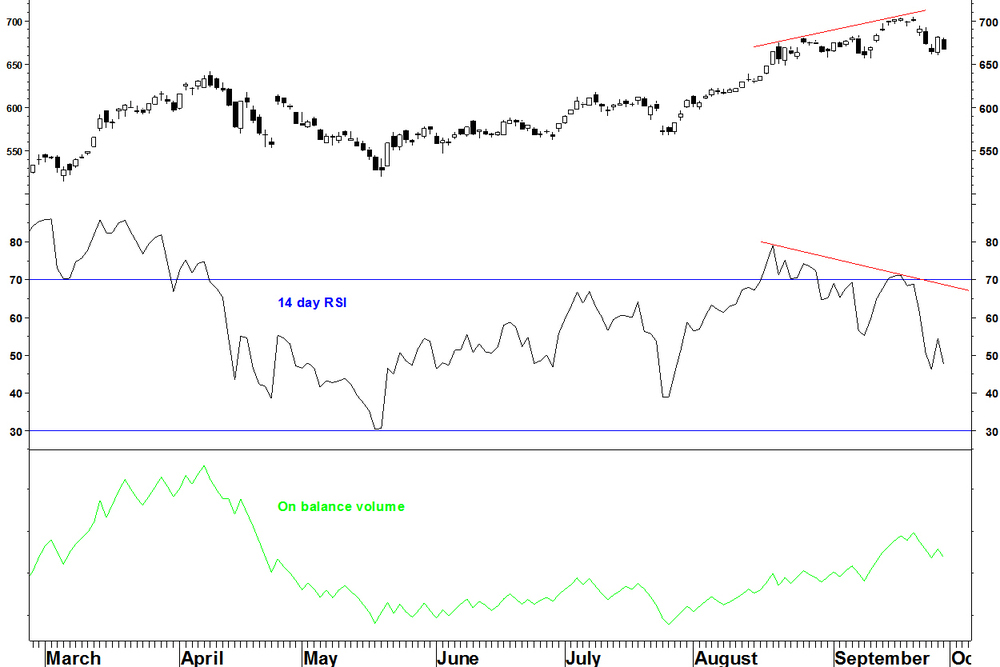
Apple (AAPL) has been an important contributor to the bull market since early 2009, as it has become the largest US stock and has become the highest market cap stock ever. Now though, Apple beginning to set up according to my RSI divergence criteria. Not every criterion is in place yet but most importantly, the weekly RSI and MACD divergences are in place. Weekly chart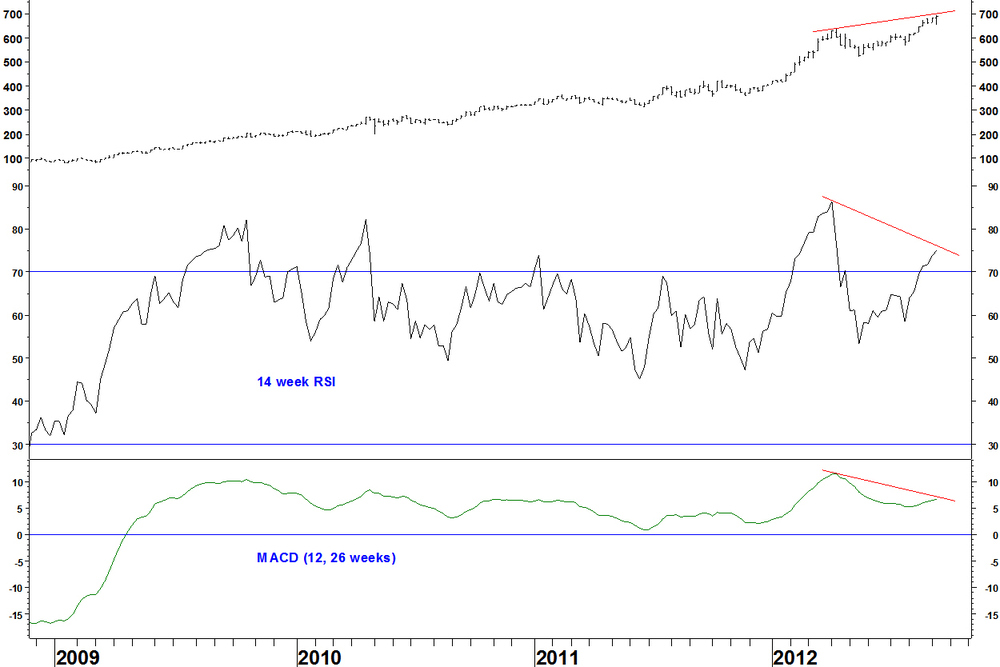
Previous times Apple has set up according to these weekly divergence criteria are:
- March 2000: The stock fell from $37 to $20 by June 2000
- January 2006: The stock fell from $85 to $50 by July 2006. This divergence was against a peak almost one year earlier
- December 2007: The stock fell from $202 to $116 by February 2008
- January 2010: This divergence failed to produce a significant pullback. The MACD divergence was minor and only an 11% pullback occurred over the next month before the stock powered higher
Daily chart

- Volume indictors aren’t something I usually follow but there is a divergence on the On Balance Volume, which means volume has been weaker with this latest advance to a new high
- The daily RSI criteria have not been met yet
Apple pairs charts
It might be possible to get all the divergence criteria met through trading a pair. Here is Apple versus the S&P500 Index. Weekly chart
- There is a MACD divergence but the RSI has not quite broken 70. The weekly RSI criteria are not yet in place
- A further rally will give the criteria but relative failure now will not give them
- A divergence can be achieved now by pairing AAPL with weaker indices such as Dow Utility or Dow Transport indices. Daily criteria are not quite in place though, although those are only ideal criteria that I’ve found most reliable. Apple could still sell off without all criteria in place
- The previous example of weekly divergence on the relative RSI and MACD came in October 2010 and this led to an eight month sideways consolidation before the uptrend resumed
- Seeing the chart turn down is an important part of the signal. Weekly divergences existed in February 2012 but were just blown away by the continuing uptrend (see vertical line)
Summary
- Not all of the criteria are in place for a short trade on Apple on price or relative
- Keep a look out for these entry set ups according to the RSI divergence criteria
- Apple has a high weighting and is a bellwether stock, so what happens here is important for the whole market
10 September
I saw an article in the Sunday Telegraph and then saw some coverage of Greece by Mike Swanson and it prompted me to take a look at Greece. There is a Greece ETF: Global X FTSE Greece 20 (GREK), which has been around since late 2011. To get a longer term view, I’ll look at the National Bank of Greece ADR (NBG), which goes back to 1999. I’m not completely convinced that Greece can go into a bull market when there is not the commonality across international indices of base formations. It is more like the US indices makes new highs but other parts of the world go sideways and develop top formations. Therefore I’ll focus on the relative strength picture for NBG. NBG versus iShares S&P Europe 350 Index (IEV)
- The weekly chart shows that whilst there have been plenty of possible bullish RSI divergences, none of them have led to a sustained low
- The MACD has been adjusted to be a percentage rather than absolute measure. If this was not done, there would be continual divergences on the way down as the numbers got smaller, which would not represent and sort of slowing of the downtrend
- Only now, is there a bullish divergence on the MACD and this is why in my RSI divergence criteria, I state that preferably, RSI divergences are accompanied by MACD divergences
Daily chart
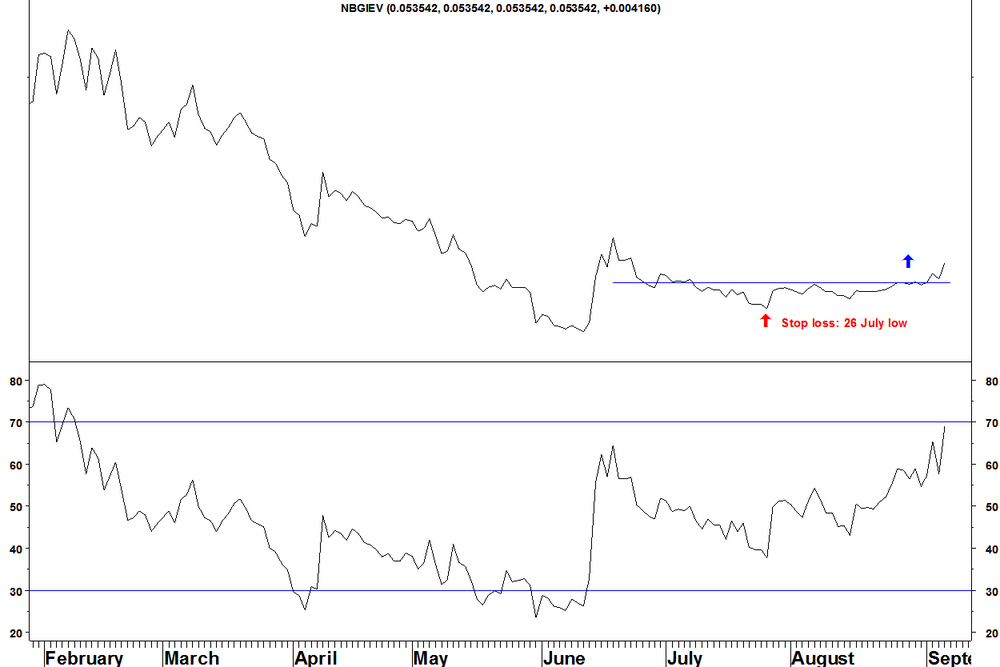
- The ratio has formed a higher low and broken above that consolidation
- The criteria for the daily chart described in my methods are not met, but there is not much choice of instruments to trade Greece and the weekly criteria are more important
NBG versus S&P500 Index
The weekly chart is much the same as against IEV. The exact choice of the sell side of this pair is not that important, it is about what NBG does.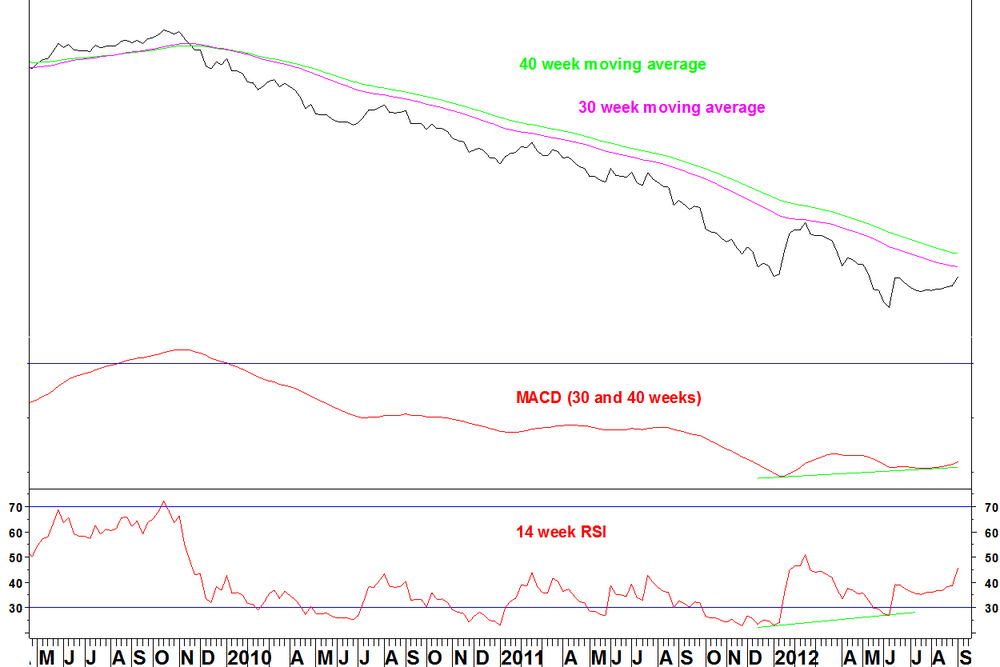
NBG will open up today. You could trade this with a stop loss below the late July low, which is quite a wide stop in percentage terms, so the position size would adjust accordingly. However, if this works it could make hundreds of percentage points.
10 September
I have had another look at this Goldman Sachs v iShares Brazil trade.
In looking for trades that fit certain criteria (in this case Bollinger Band breakouts), I should be careful that the components are not contradictory in terms of other trade types that I look for. I should be careful that I am not forcing a trade out of components that, when I look at each component against the S&P500 Index, show a different story.
In this case, the iShares Brazil (EWZ) is not the best component for a short side according to my RSI divergence criteria.
EWZ versus S&P500 Index
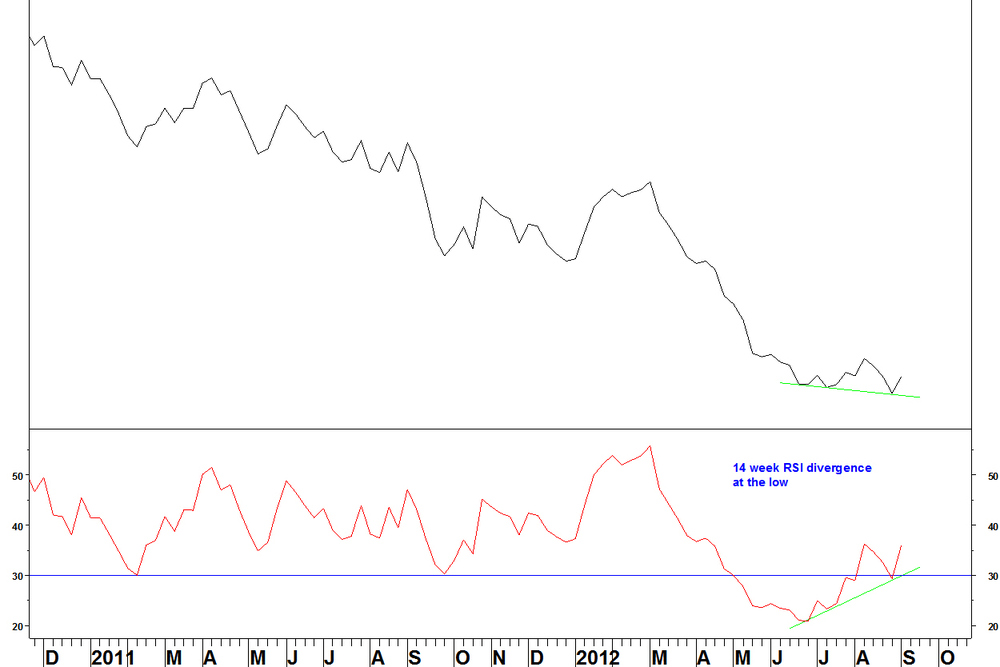
- The 14 week RSI has a bullish divergence on the latest low
Daily chart

- The June low was formed on a divergence below 30
- The 04 September low was formed with the 14 day RSI above 30
- This matches my RSI divergence criteria
On further reflection, I think it is best to take all profit on this trade now. Other ETFs as the short side against GS do not show a Bollinger Band breakout set up. There is a lack of commonality and that is not a bad lesson to take from a trade that has still made a profit!
I have got some more trade ideas with better commonality to come.
10 September
Last week, the Bollinger Band breakout on the pair of Goldman Sachs (GS) v iShares Brazil (EWZ) was given and this made 4.9% on the week.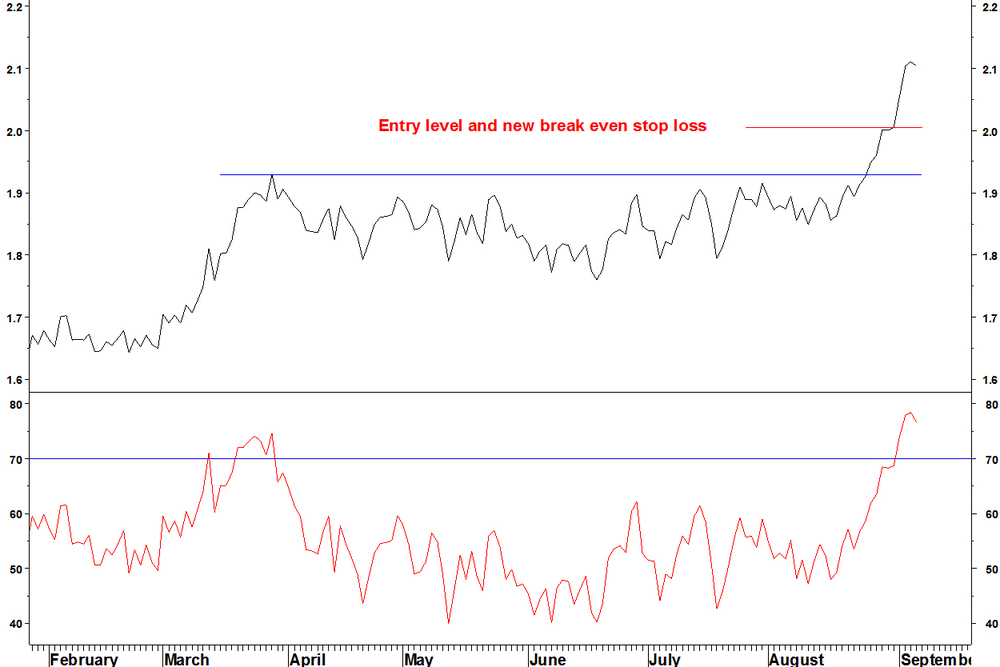
You can now take some profit and move the stop loss on the remainder to break even.
Remember though, this is a medium term position (weeks to months). Whilst there can always be pullbacks, the best examples of these trades do not pull back far or for very long.
