Greece to end underperformance?
10 September
I saw an article in the Sunday Telegraph and then saw some coverage of Greece by Mike Swanson and it prompted me to take a look at Greece. There is a Greece ETF: Global X FTSE Greece 20 (GREK), which has been around since late 2011. To get a longer term view, I’ll look at the National Bank of Greece ADR (NBG), which goes back to 1999. I’m not completely convinced that Greece can go into a bull market when there is not the commonality across international indices of base formations. It is more like the US indices makes new highs but other parts of the world go sideways and develop top formations. Therefore I’ll focus on the relative strength picture for NBG. NBG versus iShares S&P Europe 350 Index (IEV)
- The weekly chart shows that whilst there have been plenty of possible bullish RSI divergences, none of them have led to a sustained low
- The MACD has been adjusted to be a percentage rather than absolute measure. If this was not done, there would be continual divergences on the way down as the numbers got smaller, which would not represent and sort of slowing of the downtrend
- Only now, is there a bullish divergence on the MACD and this is why in my RSI divergence criteria, I state that preferably, RSI divergences are accompanied by MACD divergences
Daily chart
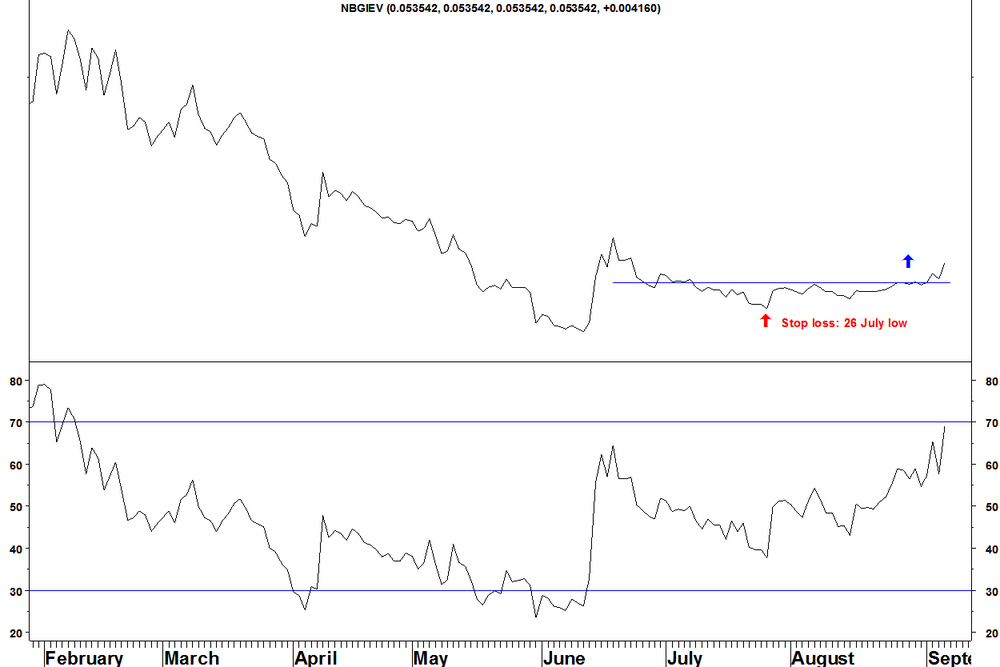
- The ratio has formed a higher low and broken above that consolidation
- The criteria for the daily chart described in my methods are not met, but there is not much choice of instruments to trade Greece and the weekly criteria are more important
NBG versus S&P500 Index
The weekly chart is much the same as against IEV. The exact choice of the sell side of this pair is not that important, it is about what NBG does.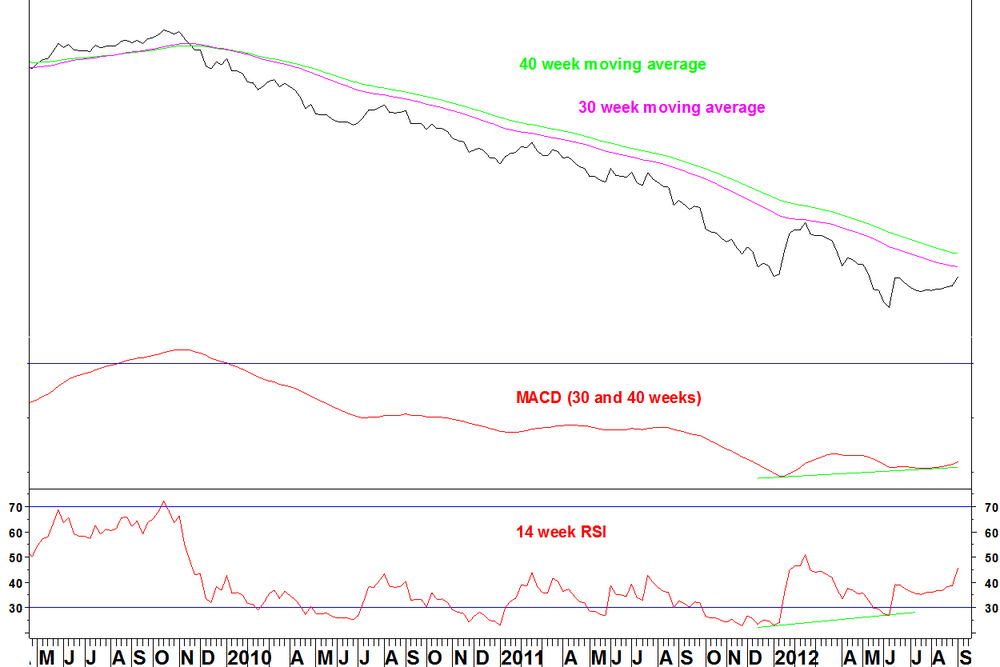
NBG will open up today. You could trade this with a stop loss below the late July low, which is quite a wide stop in percentage terms, so the position size would adjust accordingly. However, if this works it could make hundreds of percentage points.
Leave a Comment
