Coinciding breadth and momentum divergences: a hindsight example
16 October
This example is complete hindsight analysis but I want to show what I can do with my breadth tool FIRE and how combining it with my other methods (RSI divergence this time) can identify rare, high probability trading opportunities. Firstly, the weekly chart of the S&P Metals & Mining Index vs. S&P500 Index shows a (very slight) weekly bullish RSI divergence in late July. That is one of the criteria of my RSI divergence method.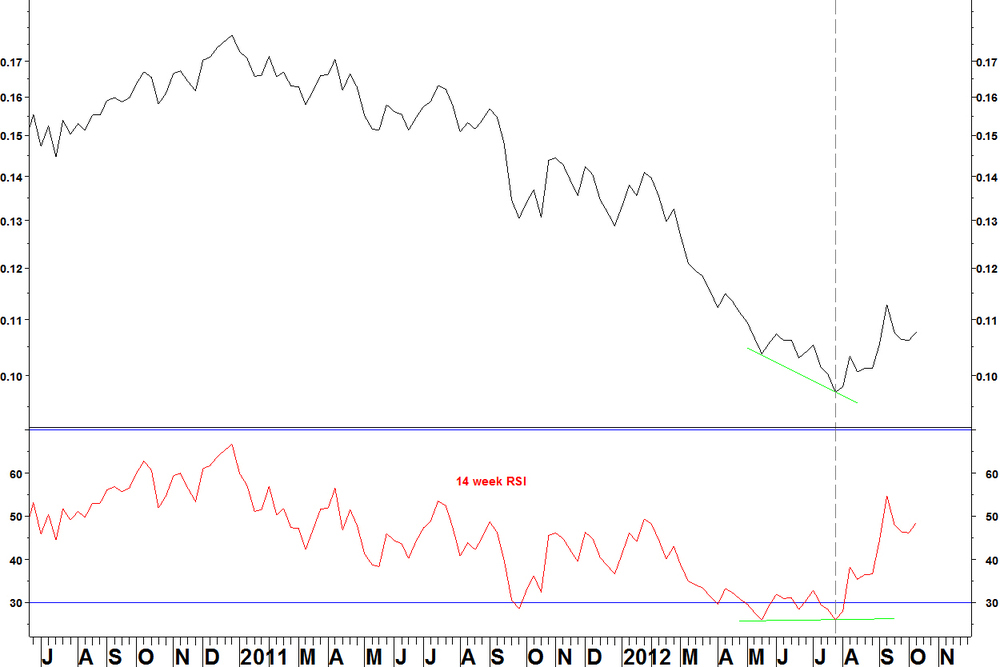
Secondly, the daily chart of the same ratio shows a divergence in May that failed to hold, then another divergence in late July but with the RSI above 30. That is another of the criteria of my RSI divergence method.

Now, look at the breadth chart for the SPDR S&P Metals and Mining (XME). This shows the percentage of stocks above their 200 day moving average. It is calculated in FIRE, my customisable breadth product, using the exact list of components of the ETF.
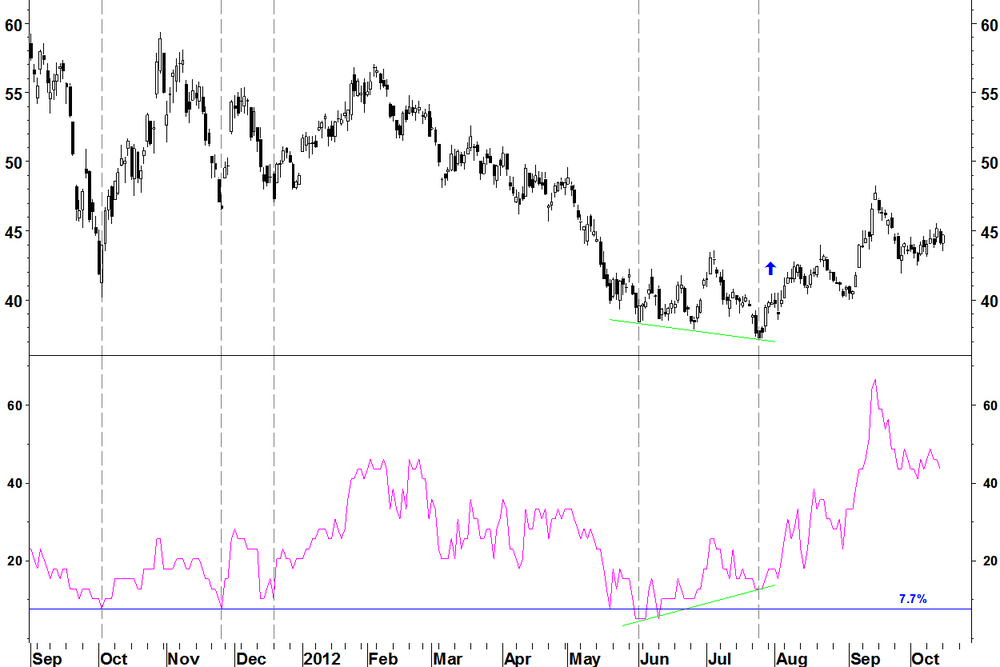
- There has been an oversold level of breadth of 7.7% (3 of the 39 components above their 200 day moving average), which marked short term lows last autumn (fall)
- Breadth reached this level and just below it (2 of 39 components) in May and June 2012
- The price low for XME came on 25 July with breadth at 12.8% (5 components). This was a bullish breadth divergence
- From that point, price rallied from $37 to $47 at the mid September high
This example shows two rare events coinciding, so increasing their significance. Think about what an RSI divergence is: it is a weakening of momentum at an extreme. It isn’t surprising that at times, this also manifests itself as a breadth divergence.
Work with me and I can find this is the sort of example for you, although understand that they are rare, that’s why they matter. A few final points:- Entry techniques to these trades can vary. For a start, this example combined absolute and relative charts. Which trade would you take?
- My method has the entry signal as a move above the intervening weekly RSI high, which doesn’t come until 10th August, marked on the daily chart. The ratio pulls back for four weeks before moving into the mid September high. Therefore this entry method is not ideal in this case
- Often with these RSI divergences, the follow through can be delayed
Leave a Comment
