What is the best breadth indicator for the broad market?
18 June
On 07 May, I introduced what I can show you on some breadth data from Pinnacle Data Corp. My main conclusion in the first article was: The new highs / new lows data on the NASDAQ stocks is the breadth data that has the best predictive record for market the indices. I’ll recap what the different breadth series showed on 07 May and what has happened since. NASDAQ cumulative highs / lows data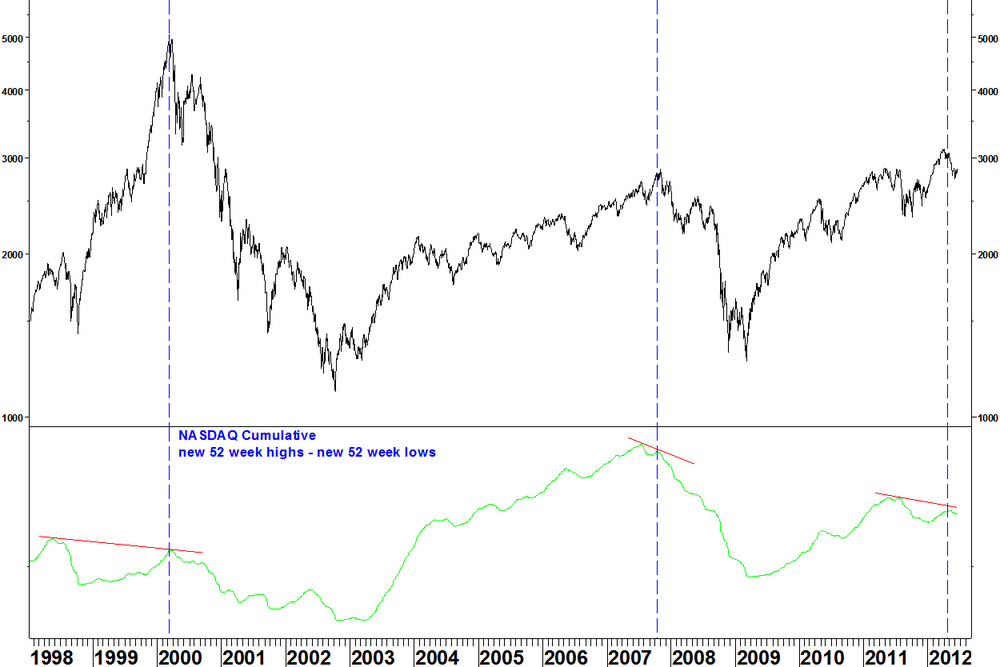
- This indicator showed a divergence in early May and an index decline has followed
- The first non confirmation in the 2003 – 2007 period marked the top
- The first non confirmation since the 2009 low marked a peak. We don’t know for sure whether it marked a long term top yet
- The 1998 to 2000 period is a reminder that not every non confirmation marks a top. It just means that conditions are ripe for a top. You still have to wait for the top to form
Zooming into the recent period
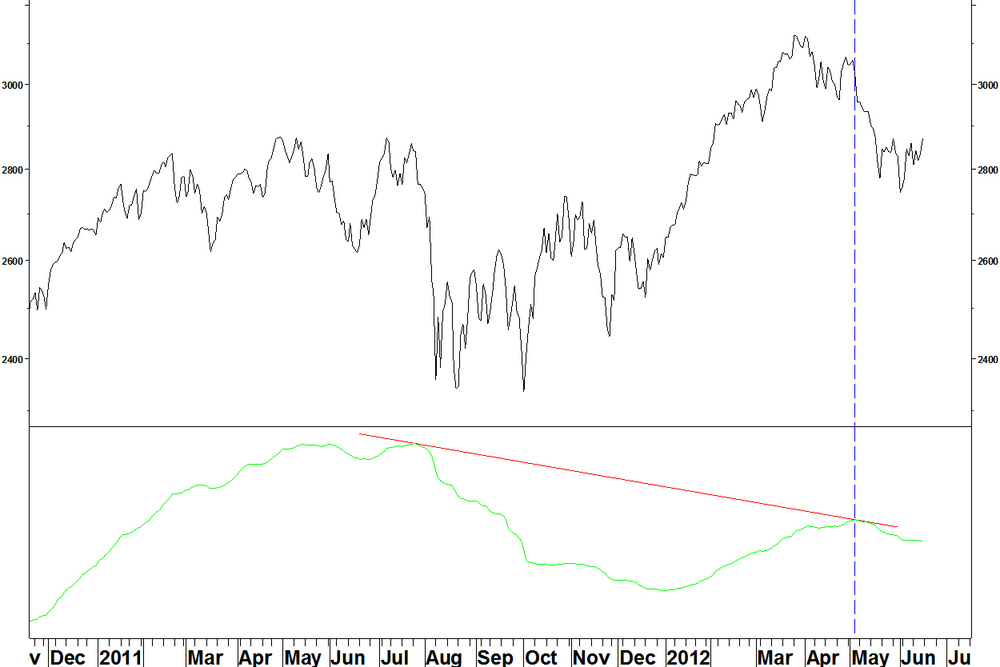
The breadth line peaks one month after the NASDAQ Composite Index, so this isn’t a short term timing tool.
Now compare with the NYSE new highs / new lows data. NYSE Composite Index and cumulative daily new highs / new lows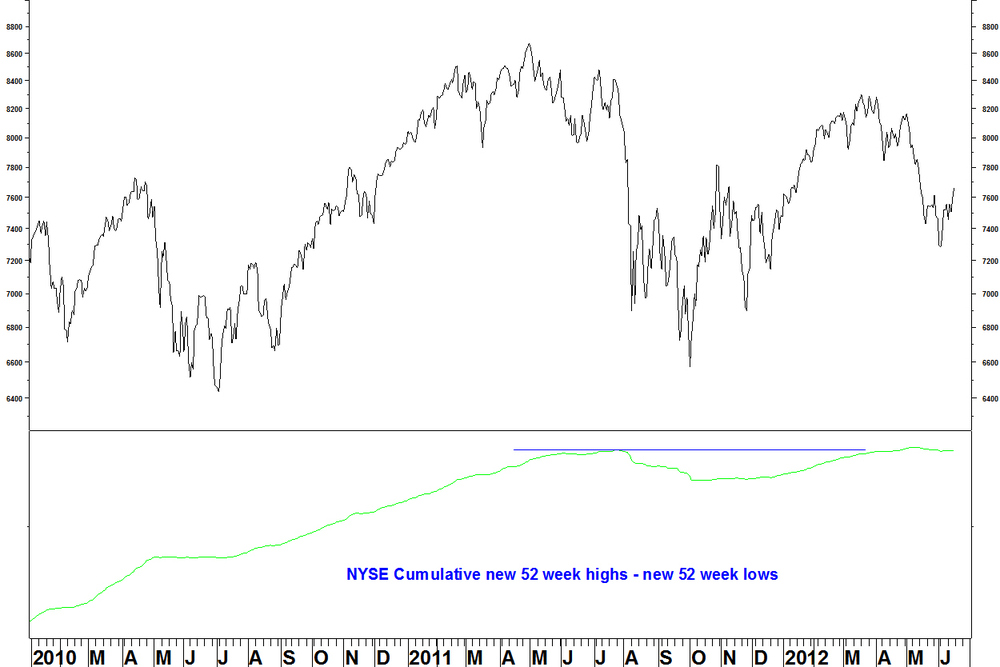
- This spring, the breadth indicator broke above the summer 2011 high despite the index not breaking that high
- There has been a negligible decline in the breadth indicator to accompany the index decline since March
- The reason for this (I believe) is that bond funds are mainly listed on the NYSE, trading as stocks but behaving differently to stocks, therefore spoiling the stock breadth data
I said in May I’d look at the cumulative daily advance / decline series for the NYSE, so here it is.
NYSE Composite Index and cumulative daily advances / declines
- There was a divergence at the 2007 high
- There was also a divergence at the 2000 high (not shown), which like the other divergences at the time, built up over two years
- There is now no divergence
- It would be tidier if there was a divergence, to help confirm the NASDAQ highs / lows divergence. Its absence might also be due to the bond funds on the NYSE
Conclusions
- The NASDAQ highs/ lows indicator has the best record for divergences leading to market declines and this has been confirmed by the action since early May
- The divergence formed at the March high remains the main feature
- A new index high or breadth indicator high (above the summer 2011 high) is needed to negate this and we take it that indices have made long term peaks until that happens
Leave a Comment
