Update on ongoing ideas
11 June
Here is an update on how some situations identified in previous weeks have developed. Simon Property Group (SPG) v iShares Real Estate (IYR) On 21 May, I showed SPG forming a bearish divergence against IYR on the weekly chart. The requirement on the daily chart was a new high with RSI below 70.
The updated chart shows this is still a possibility. If the criteria are met, a formation break can be taken as the entry signal.
Patni Computer (PTI) v NASDAQ 100 Trust (QQQ) On 28 May, I showed the ratio of PTI v QQQ contracting on its Bollinger bands.I am still waiting for a break above the upper band. This must be an end of week close above the 25 week bands.

U.S. Dollar v Japanese Yen
On 23 April, I showed the USD making a long term moving average crossover against the JPY. These crossovers are indications that something has changed, not exact entry criteria. First, the moving average crossover must be maintained. The MACD on the 30 and 40 week moving average has gone back slightly negative. This must go positive again before we can get interested.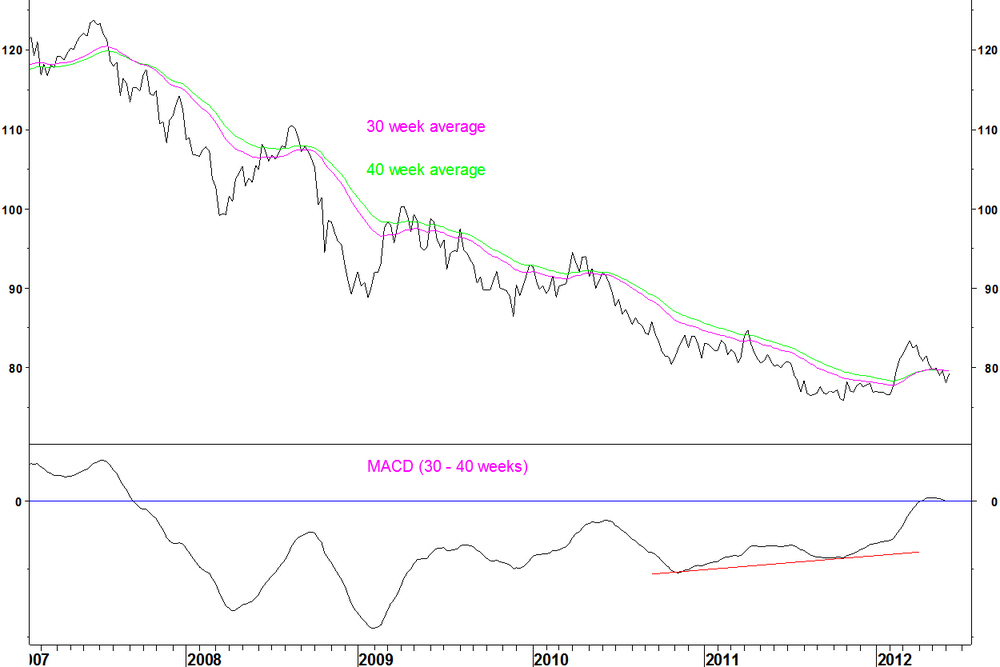
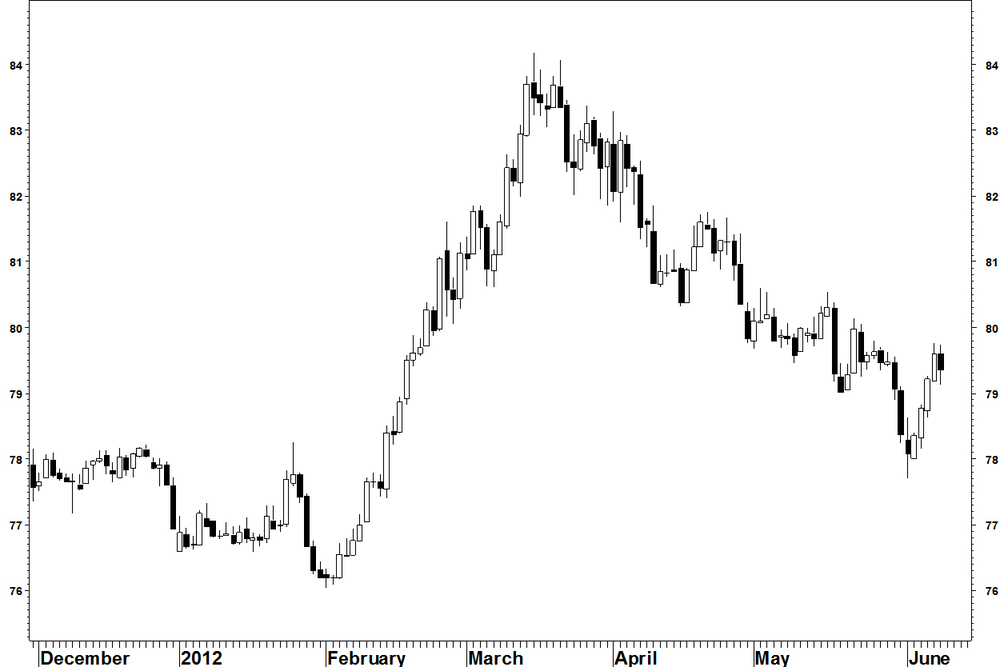
Then, break above a base formation on the daily chart could be an entry signal.
Bonds
On 30 May, I showed that if 30 year bond yields fell further, there could be a bullish divergence on the 14 week RSI. I showed that these divergences were rare and had a decent record of at least halting a trend, often reversing it for a while. A divergence was formed against the September 2011 low at the start of June. Last week, the yield rallied from the divergence. The daily RSI divergence criteria have not been met but there is a choice of one for bond yield charts. Those criteria are for picking the best examples from the thousands of stocks and millions of stock pairs that exist.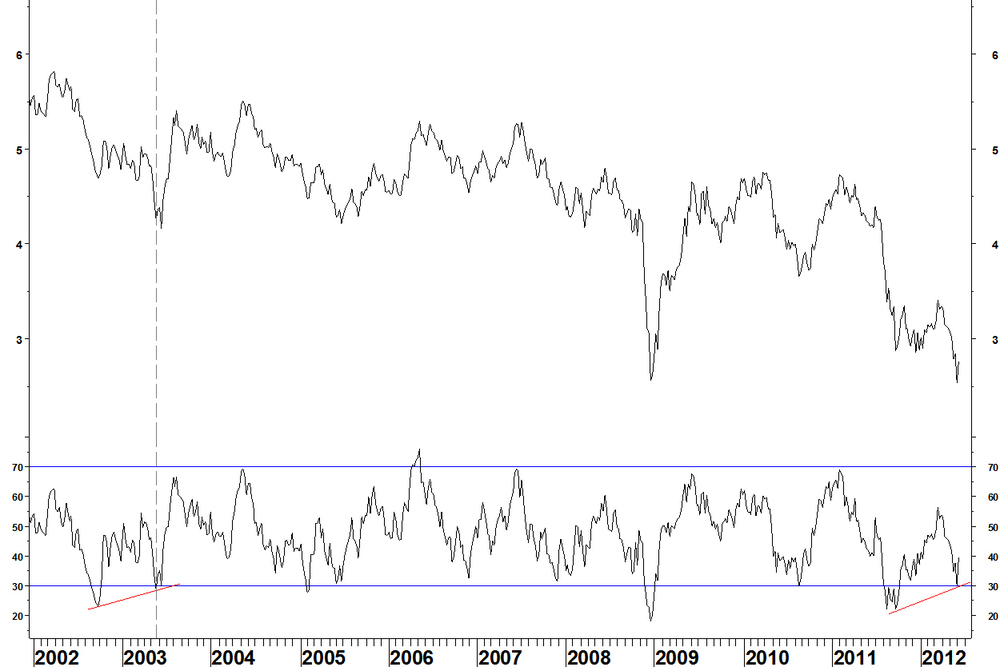
This example lacks a clear entry set up for a short trade on bonds but any long bond positions should be exited.
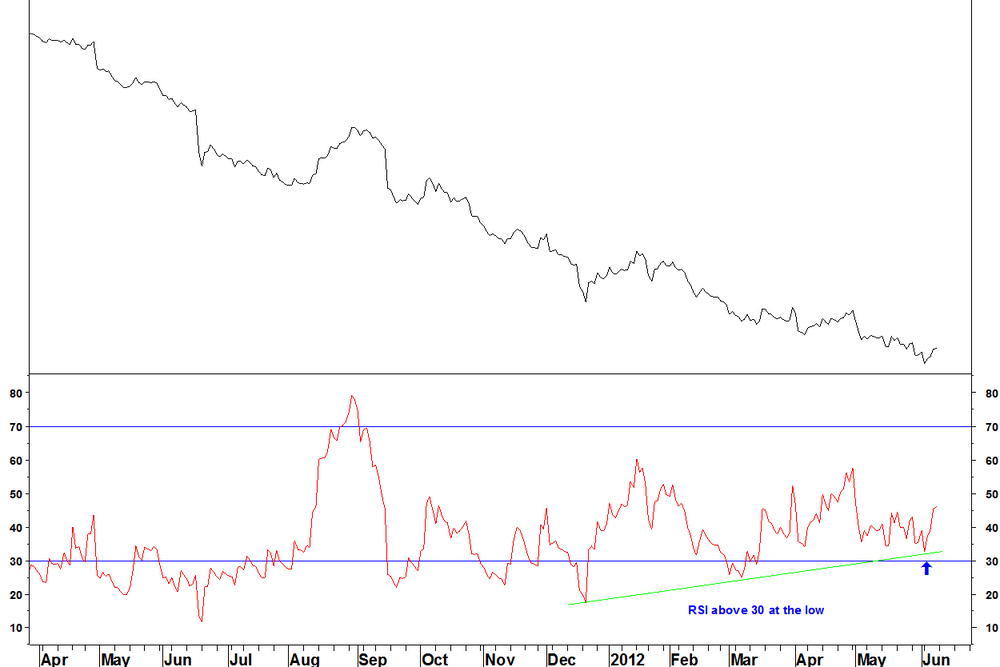
Research in Motion (RIMM) v NASDAQ 100 (NDX) I got bitten by RIMM once but whilst this has drifted slightly lower, another RSI divergence entry possibility exits. A break above the intervening RSI high for the 14 week RSI would be an entry signal.
The daily chart shows RSI holding above 30, meeting one entry condition.
Leave a Comment
