RIMM: unloved but set for reversion
24 April
Research in Motion (RIMM) has been the subject of much commentary, regarding the defeat of Blackberry by other devices. Now, everyone knows the story, it might be the low, on relative strength at least.
Plotting RIMM against the NASDAQ 100 Index, there is a bullish weekly RSI divergence and a MACD divergence.The MACD that I used is adjusted for the fact that the ratio has fallen so much.
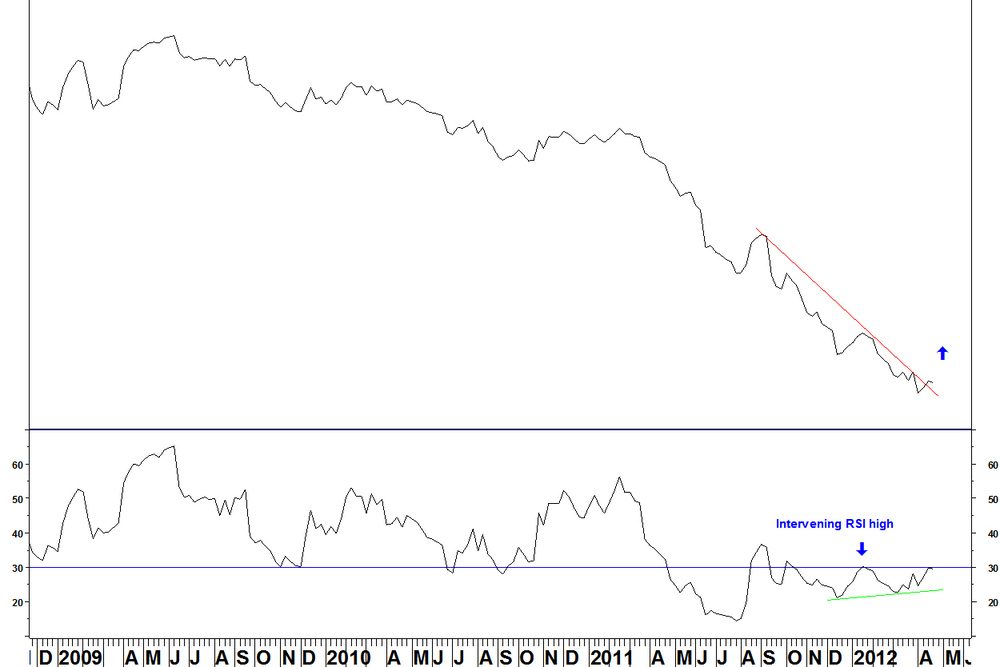
- The late 2011/ early 2012 divergence was not followed by a break above the intervening RSI high, so did not set up as required.
- Now, the intervening RSI high is from the week ending 20 January, just above 30.
- With the RSI just below 30 as of last Friday, an outperforming week will give this signal.
- Today, RIMM outperforms and the buy signal would be an end of week close for the RSI above that intervening high.
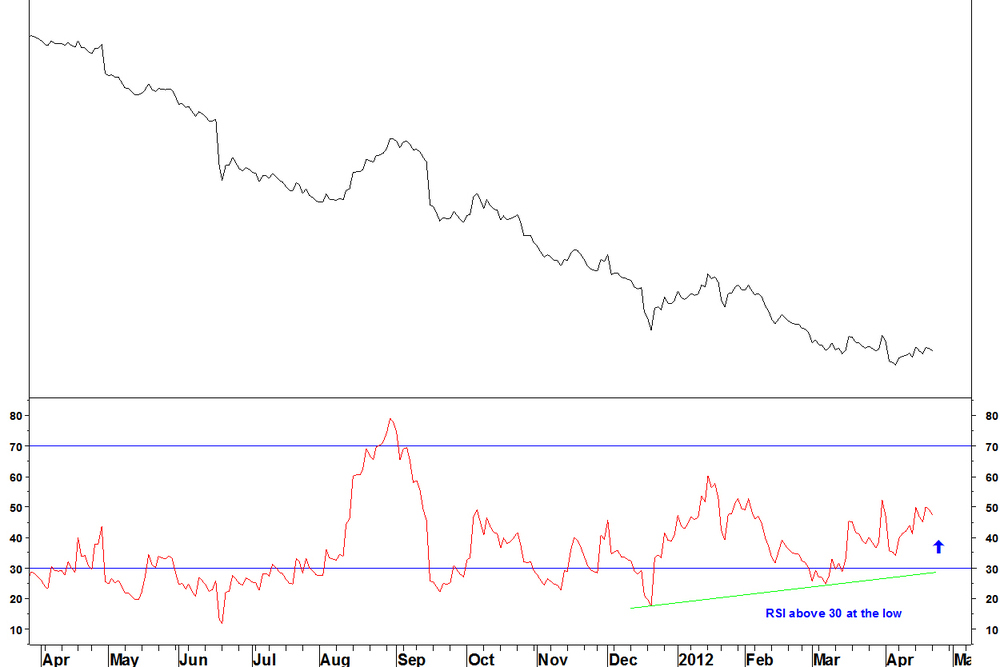
On the daily chart, there have been a succession of RSI divergences that have failed to hold the decline, which is why I look for weekly divergences. Now the daily RSI is above 30 and the MACD (adjusted again) also has bullish divergence.
The stop loss would be a move back into oversold on the weekly RSI or a weekly reversal. I’ve seen RIMM described as a binary bet, a company that could go under. I’ll leave the fundamentals to other people, here is a decent trading set up that meets my RSI divergence criteria.
