Rotation in favour of the health sector – Medtronic as an example
Since the indices made their lows on 15 October, the rally has mainly seen most defensive sectors (consumer staples, utilities, telecom) underperform, as would be expected. The one exception is the health care sector, which has outperformed the S&P 500 Index.
Medtronic (MDT) v S&P 500 Index

- MDT has broken resistance against the S&P 500 Index
- The pair broke resistance on the market decline up to 14 October. Although MDT underperformed in the next few days, it recovered most of this and I expect the breakout to hold
- This break higher is not one of my defined patterns that I look for. It is not specific enough
There are 68 S&P industry categories. Here is a pending long term moving average crossover of a pair made from two of them.
S&P Health Care Equipment & Supplies Index versus S&P Media Index
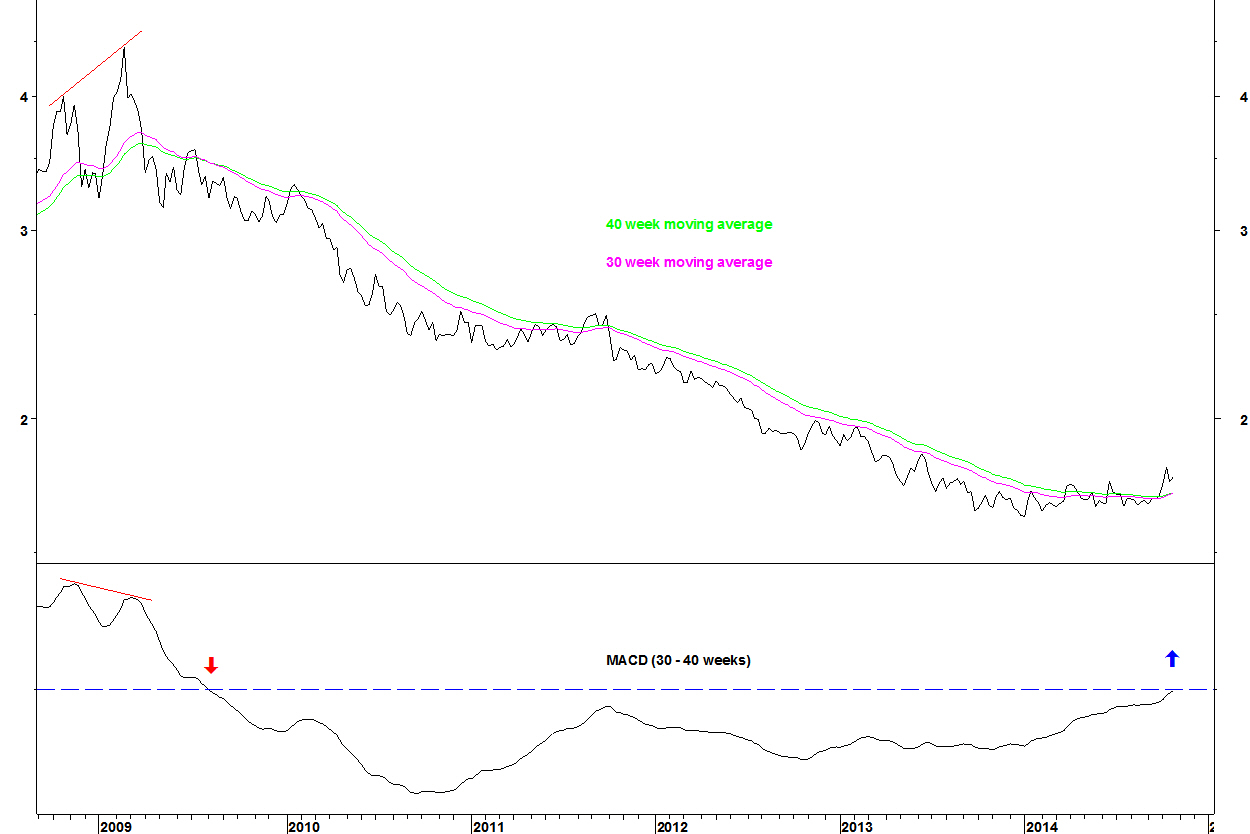
- In my long term moving average crossover method, I look for charts without a crossover for four years. The 30 and 40 week moving averages last crossed in August 2009
- There is a long term bullish divergence on the MACD (this is percentage difference based, it isn’t in place because the pair has fallen and the numbers are getting smaller – it would exist if the pair were inverted)
- The pair has broken above the base formed since September 2013
As I have discussed previously, these crossovers don’t give the timing of when the chart will move, it could go sideways for months. My Bollinger Band breakout method is better for finding charts about to move.
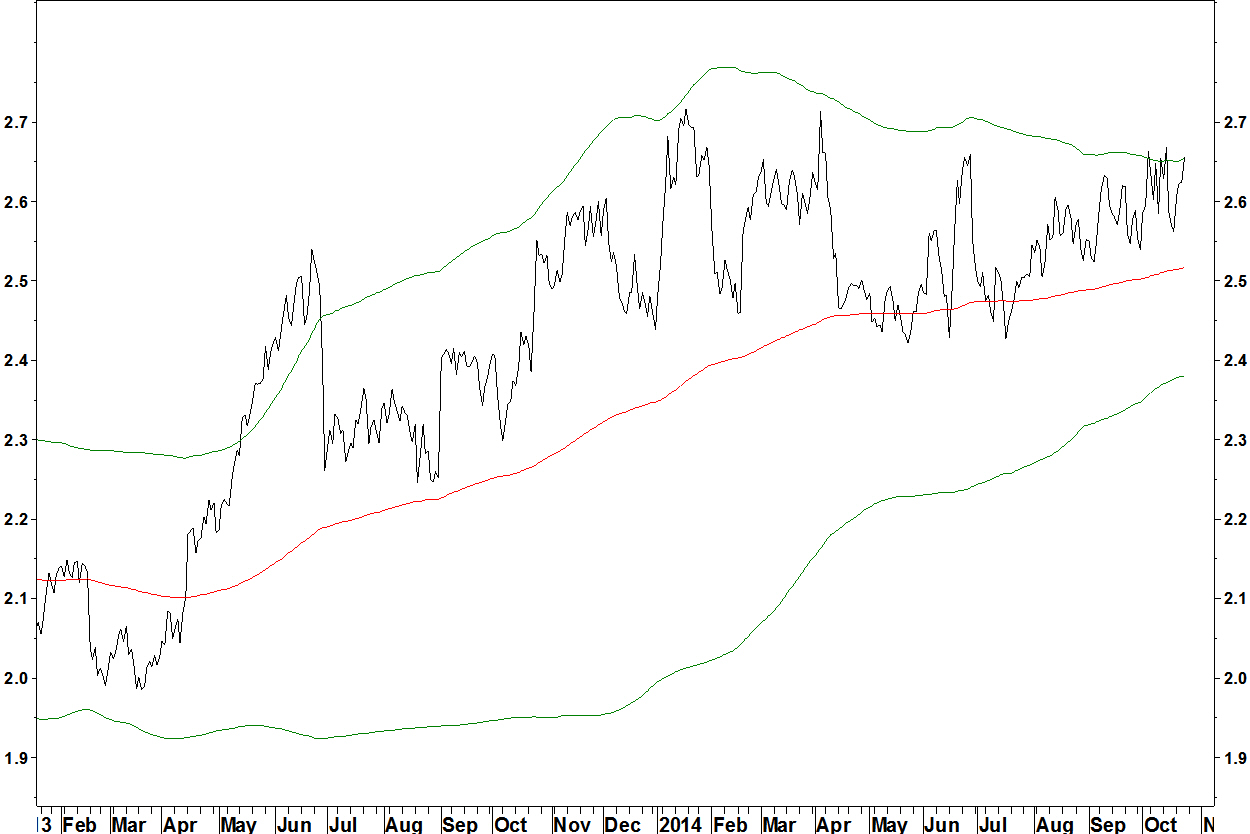
Medtronic (MDT) v Shaw Communications (SJR)
SJR is a stock from the Media sector that gives us a pair fitting my Bollinger Band breakout trade criteria.

- After the consolidation since January 2014, the 50 week Bollinger Bands are at their tightest in over 3 years
- The 14 week RSI is mid range
- There is a base and a first step above it, so the 50 week moving average has an identifiable direction. I look for breaks in the direction of the moving average
- There is scope for reversion after the multi year downtrend
The entry signal is an expansion of the bands and a close beyond the band on an end of week basis.
Daily chart
This is the same bands on a daily chart. That price has remained near the upper band during October rather than pulling back sharply from it as before, suggesting a break higher is imminent.
MDT v GameStop Corp (GME)
The sell side on this pair is from the consumer discretionary sector.

- This daily chart shows 200 day (40 week) Bollinger Bands
- The buy signal is an expansion of the bands and an end of week close above the upper band
- This should also entail resistance in blue being broken
Summary
- Medtronic has broken resistance against the S&P 500 Index
- There is a pending long term moving average crossover on the pair chart of the Health Care Equipment & Supplies sector vs. the Media sector
- Medtronic is poised for Bollinger Band breakouts against Shaw Communications (SJR) and GameStop Corp (GME)
- Watch for these band breaks then trade accordingly, re-balance sector allocations, understand the defensive nature of these rotations
