Bollinger Band breakout on last week’s Goldman Sachs idea
03 September
Of the ideas reviewed last week, one has given its entry signal and that is the Bollinger Band breakout on the pair of Goldman Sachs (GS) v iShares Brazil (EWZ). This has now given an entry signal according to my Bollinger Band criteria.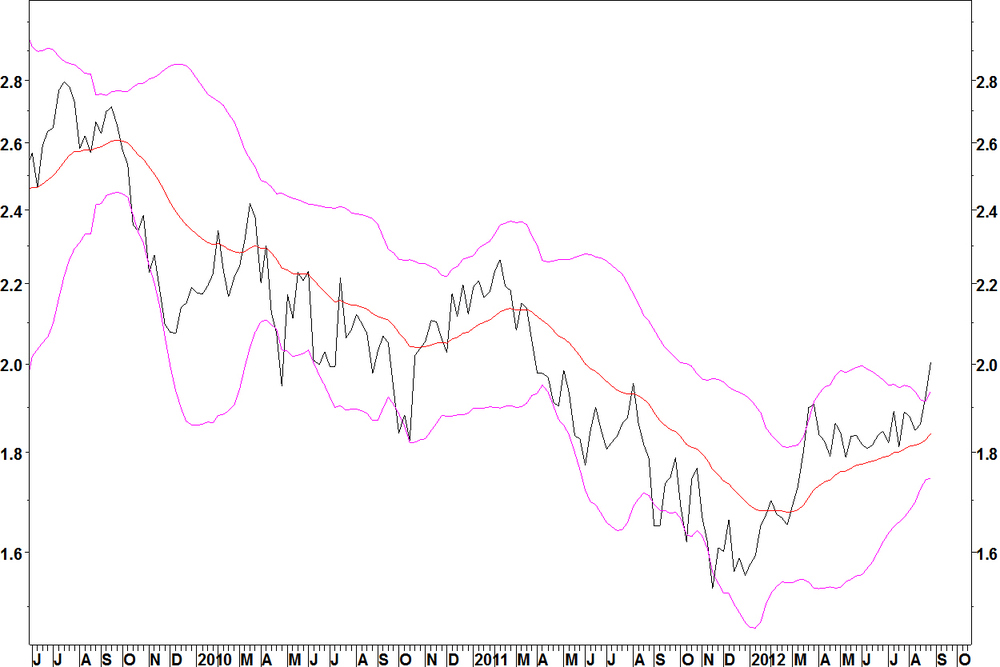
- The ratio formed a base in late 2011, rallied and consolidated since late March
- This consolidation allowed the 25 week Bollinger Bands to contract to their tightest in three years
- The 25 week moving average has turned higher
- The ratio broke above the upper band in week ending 24 August
- The expansion of the band width occurred last week, that is the entry signal to be going long GS, short EWZ
Daily chart

- The daily chart shows the ratio has broken resistance since March
- The stop loss is below the consolidation that preceded the breakout, at the red line at 1.83
- This is a medium term position (weeks to months), so it could pull back a bit in the short term. However, the best examples of these trades do not pull back far or for very long
Leave a Comment
