US 30 year bond yield heading for a bullish divergence
30 May
Bond prices are at a high and yields are near their record low, formed in December 2008. Today’s Daily Express front page headline told us that interest rates would be on hold for five years. That relates to UK rates and I will show US rates (that’s the data that I can reproduce) but they have moved closely together for a long time. The chart shows the U.S. 30 year bond yield (TYX) , with the 14 week RSI.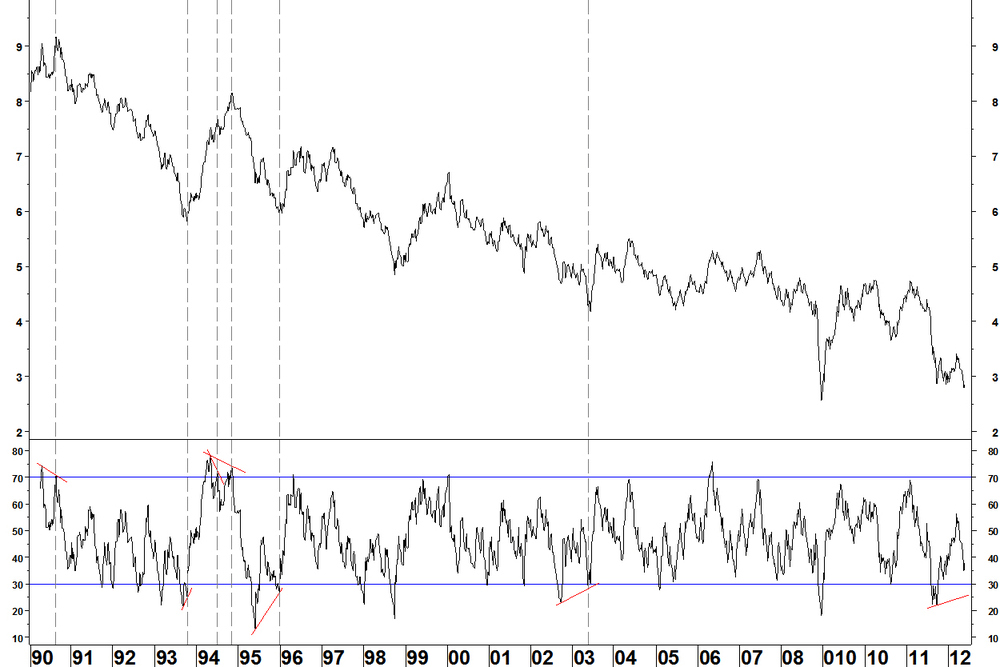
- In August 1990, a high for TYX was formed around 9% on a bearish RSI divergence
- In September 1992, a bullish RSI divergence was formed. This only temporarily halted the rate decline
- In July 1994 the first weekly RSI divergence temporarily halted the decline but the second divergence in early November 1994 really did halt it
- In December 1995 a divergence was formed across troughs (7 months apart) that halted the rate decline
- The next divergence came in May 2003 and this halted the rate decline. Again, this was across troughs, 8 months apart
- There have been no divergences since then
Now, if the rate continues lower, we could get a bullish divergence across troughs, currently 8 months apart since September 2011.
That would then be reason to look for a low in yields and more closely at how to enter that trade. Daily chart
The daily chart also sets up for a bullish divergence.
Regarding my daily RSI criteria, I cannot be so exacting as with stocks to insist on a daily divergence that is above 30, after all, there are not hundreds of yield charts to choose from. Main points- Weekly divergences are rare, with a good record of at least halting a move and often reversing it
- Sentiment allows plenty of scope for a yield recovery
Leave a Comment
